Forex trading can be a complex endeavor, but there are several technical indicators that can help traders make informed decisions. One such indicator is Bollinger Bands, a popular tool used by many traders to analyze market volatility and identify potential trading opportunities. In this article, we will explore what Bollinger Bands are and how to use them effectively in forex trading.
What are Bollinger Bands?
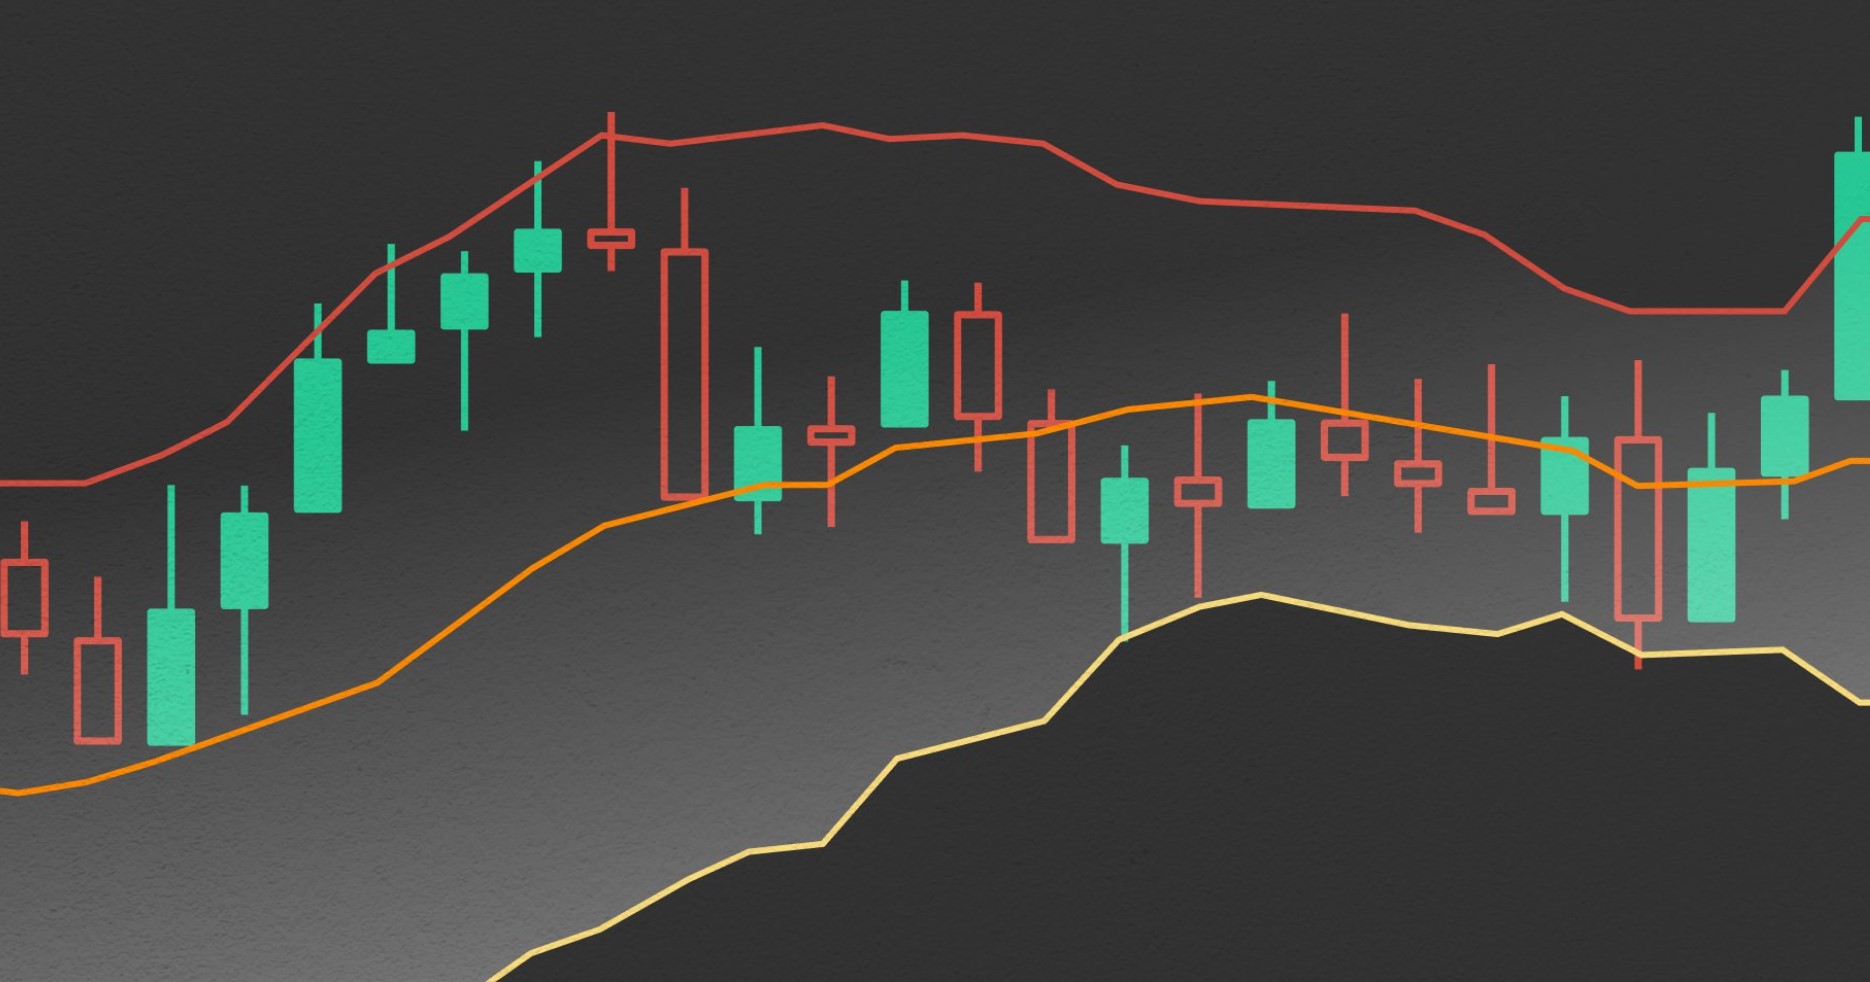
Bollinger Bands are a popular technical analysis tool used by traders to analyze price volatility and identify potential trading opportunities. Developed by John Bollinger, this indicator consists of three lines plotted on a price chart: a simple moving average (SMA) line in the middle and two standard deviation lines (upper and lower bands) above and below the SMA line.
- The Bollinger Bands are dynamic in nature, meaning they adjust to changes in market volatility. When volatility increases, the bands expand, and when volatility decreases, the bands contract. This makes Bollinger Bands particularly useful for assessing the current market conditions and potential price movements.
- The middle line, or the SMA, represents the average price over a specific period. The most commonly used period is 20, meaning it calculates the average price over the past 20 periods (such as 20 days or 20 hours, depending on the timeframe). The upper band is typically set at two standard deviations above the SMA, while the lower band is set at two standard deviations below the SMA.
- The distance between the upper and lower bands is known as the band width. A narrow band width indicates low volatility, while a wide band width suggests high volatility. Traders often use the band width as a measure of market volatility and potential trading opportunities.
Bollinger Bands can serve several purposes in trading. Firstly, they can help identify overbought and oversold conditions in the market. When prices touch or exceed the upper band, it may signal an overbought condition, suggesting a potential reversal or correction in price. Conversely, when prices touch or fall below the lower band, it may indicate an oversold condition, presenting a potential buying opportunity.
Furthermore, Bollinger Bands can assist in spotting potential trend reversals. When a price trend loses momentum, the bands may start to squeeze together, indicating a possible trend change. Traders often wait for the price to break out of the bands in the opposite direction, providing confirmation of a reversal.
Bollinger Bands can also help identify breakout opportunities. Breakouts occur when prices move outside the bands, indicating a potential continuation or reversal of the current trend. Traders often look for significant price movements accompanied by increased volume as confirmation of a breakout.
In conclusion, Bollinger Bands are a versatile technical indicator used in trading to assess price volatility, identify overbought or oversold conditions, spot potential trend reversals, and identify breakout opportunities. By understanding and effectively utilizing Bollinger Bands, traders can make more informed trading decisions and improve their overall trading performance.
How to Use Bollinger Bands in Forex Trading
Using Bollinger Bands in forex trading can provide valuable insights into price movements and potential trend reversals. Here’s a step-by-step guide on how to effectively utilize Bollinger Bands:
- Understanding Band Width: The band width, also known as the volatility indicator, is the numerical representation of the distance between the upper and lower Bollinger Bands. A narrower band width indicates lower volatility, while a wider band width suggests higher volatility.
- Identifying Overbought and Oversold Conditions: Bollinger Bands can help identify overbought and oversold conditions in the market. When prices touch or exceed the upper band, it may indicate an overbought condition, suggesting a potential reversal or a price correction. Conversely, when prices touch or fall below the lower band, it may signal an oversold condition, indicating a possible buying opportunity.
- Spotting Breakouts: Bollinger Bands can also assist in identifying breakout opportunities. Breakouts occur when prices move outside the bands, indicating a potential trend continuation or reversal. Traders often look for significant price movements accompanied by increased volume as confirmation of a breakout.
- Confirming Trend Reversals: Bollinger Bands can be useful in confirming trend reversals. When a price trend is losing momentum, the bands may begin to squeeze together, indicating a potential trend change. Traders typically wait for the price to break out of the bands in the opposite direction, providing confirmation of a reversal.
- Combining Bollinger Bands with Other Indicators: To enhance trading strategies, traders often combine Bollinger Bands with other technical indicators such as moving averages, oscillators, or trend lines. This can provide additional confirmation and increase the probability of successful trades.
- Setting Stop Loss and Take Profit Levels: Bollinger Bands can help determine appropriate stop loss and take profit levels. Traders may consider placing stop loss orders just outside the bands to protect against potential adverse price movements. Similarly, take profit orders can be set near the opposite band or at key support/resistance levels.
FAQs About Using Bollinger Bands in Forex Trading
Q1: How do I set the parameters for Bollinger Bands?
To set the parameters for Bollinger Bands, you need to specify the period (number of bars) for the simple moving average and the number of standard deviations for the upper and lower bands. The most commonly used settings are a 20-period SMA and 2 standard deviations.
Q2: Can Bollinger Bands be used in conjunction with other indicators?
Absolutely! Bollinger Bands work well when combined with other indicators such as the Relative Strength Index (RSI) or the Moving Average Convergence Divergence (MACD). This combination can provide additional confirmation signals and improve trading accuracy.
Q3: How do I interpret a squeeze in Bollinger Bands?
A squeeze occurs when the Bollinger Bands contract tightly, indicating low volatility and a potential breakout in the near future. Traders often interpret a squeeze as a calm before the storm, suggesting an impending price move. They may wait for a breakout and increased volatility to enter a trade.
Q4: Should I rely solely on Bollinger Bands for trading decisions?
While Bollinger Bands are a powerful tool, it’s important to use them in conjunction with other technical indicators, chart patterns, and fundamental analysis. This comprehensive approach can provide a more well-rounded view of the market and improve decision-making.
Q5: Are Bollinger Bands suitable for all timeframes?
Yes, Bollinger Bands can be applied to various timeframes, including daily, hourly, or even minute charts. Traders should adjust the settings based on their preferred timeframe and trading style.
Q6: Can Bollinger Bands be used in other financial markets besides forex?
Absolutely! Bollinger Bands can be applied to any financial market, including stocks, commodities, cryptocurrencies, and more. The principles remain the same, regardless of the asset being traded.
Bollinger Bands are a valuable tool in forex trading, providing insights into market volatility, trend reversals, and potential breakouts. By understanding how to interpret and utilize Bollinger Bands effectively, traders can make more informed trading decisions. However, it’s essential to combine Bollinger Bands with other indicators and analysis methods to increase trading accuracy and minimize risks.
Remember, mastering the use of Bollinger Bands takes practice and experience. So, start experimenting with this powerful indicator in your forex trading journey and see how it can enhance your decision-making process.